


Finance glossary
What is MFA?
Multi-factor authentication (MFA) is a security method that requires users to prove their identity using two or more distinct factors before accessing …
Financial statements are a foundational component of financial reporting and help clarify a company’s health and performance.
Financial statements are a foundational component of financial reporting and help clarify a company’s health and performance.
The ability to read and interpret financial statements is a critical skill, irrespective of whether you are:
Despite their obvious value, making sense of financial statements can be complex and daunting. Most (if not all) are filled with technical terms, industry jargon, and numbers that appear to make no sense.
At their core, however, financial statements tell the story of a company’s economic activities. Via careful analysis of the balance sheet, income statement and cash flow statement, you can assess the profitability, liquidity and overall financial stability of the company in question.
Note that financial statements are both a snapshot of company performance and an indicator of potential risks and opportunities in the future.
In this article, we’ll demystify financial statements, break down each component and explain how to make sense of key data.
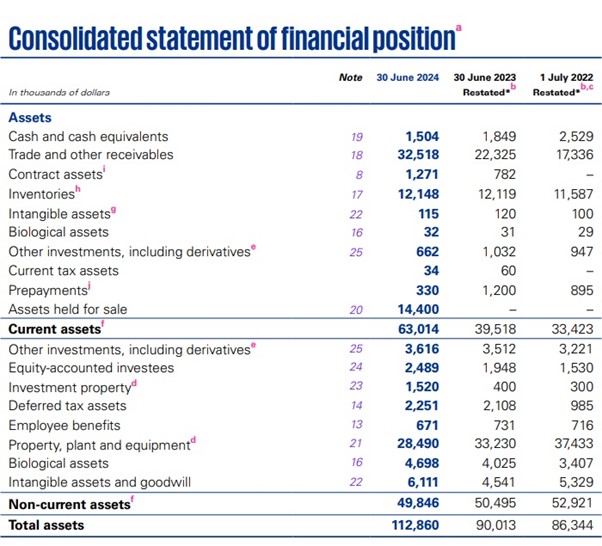
The balance sheet provides a clear, moment-in-time overview of a company’s financial position. It outlines what the company owns (assets), what it owes (liabilities) and the remaining interest attributable to shareholders (equity).
In some cases, the balance sheet may be titled “Consolidated statement of financial position.”
Assets are everything the company owns that has economic value.
Here, there are two primary categories:
The total value of a company’s assets shows the resources it has at its disposal to generate future revenue.
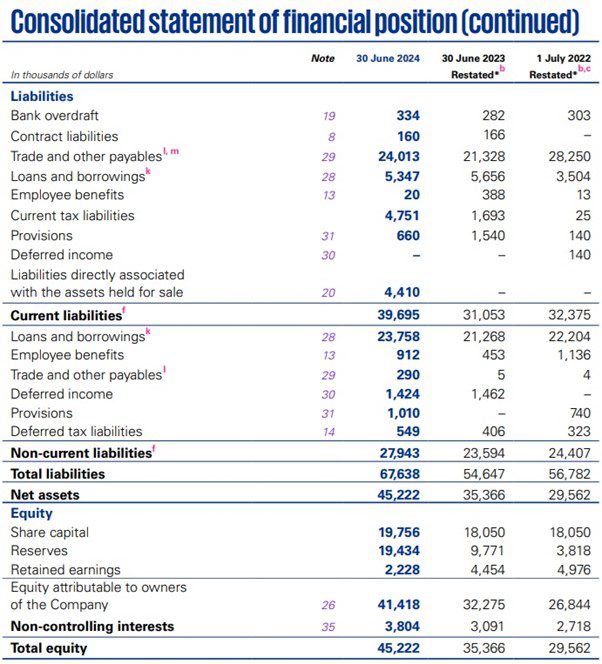
Liabilities represent the financial obligations a company has to other entities.
Like assets, liabilities can also be split into two categories:
Liabilities help you understand the company’s debt structure and obligations and form a key part of assessing financial risk.
Shareholder equity (SE) is a representation of a company’s net worth. In other words, it is equal to the dollar amount that would be returned to shareholders if the company was liquidated and paid off all its debts.
Investors and analysts look at SE to evaluate a company’s financial health. High equity tends to indicate a company in a strong financial position. However, it’s also important to consider the ratio of debt to equity.
To understand the relationship between assets, liabilities and equity, the following equation must always hold true:
Assets = Liabilities + Shareholder Equity
Based on this equation, we see that all company assets are financed via either debt or shareholder equity. This idea can be better understood by looking at balance sheet ratios.
Some useful ratios include the current ratio – which measures the relationship between current assets and current liabilities – and the debt-to-equity ratio. More detail on important financial ratios is explained in the final section.
In any case, keep three questions in mind to gauge overall financial health:
Some of these can be answered by comparing the company’s performance to industry benchmarks and competitor financial statements.
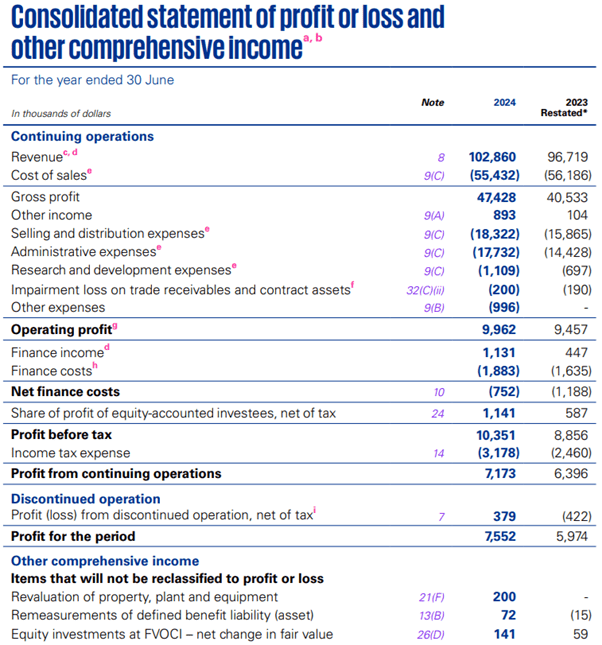
The income statement details the company’s financial performance over a specific period (either monthly, quarterly or annually).
Also known as a profit and loss (P&L) statement, an income statement tracks a company’s revenue, expenses and profits. In the process, it may shed light on the company’s operations, the performance of its management, or its performance relative to competitors.
Income statements vary according to regulations and the scope and nature of business activities. Nevertheless, here is some information you can expect to see on most statements.
Australian businesses tend to report revenue on an income statement as income earned from the company’s primary business activities. In most cases, this is the sale of product or services.
Other income constitutes income derived from other sources, such as interest earned on capital from a bank, royalty payments, or an increase in the fair value of an investment property.
Cost of goods sold refers to the cost of producing a product or service for sale. A calculation of COGS tends to include material, labour and overhead costs (such as electricity).
Some service-based businesses may report COGS as “Cost of sales” on their income statements.
Gross profit is found by subtracting COGS or the total cost of sales from revenue. Gross profit is a strong indicator of production efficiency and is used by businesses to set price and sales targets.
Operating expenses are any costs required to run the business that are not directly related to production. In other words, they are closely tied to the company’s primary business activities.
On an income statement, expense reporting may be grouped as follows:
Specific examples of common business operating expenses include public relations, advertising and sponsorship, insurance premiums, lease expenses and depreciation on assets used in operations.
Operating profit (also known as operating income) is another critical metric that measures the profitability of business operations. It is calculated by subtracting expenses from gross profit.
Non-operating items describe revenues or expenses that arise from activities outside the company’s primary business operations. These items are often infrequent, incidental and do not recur.
Common examples include:
Net profit (net income) is the number that remains after all expenses, taxes and non-operating items have been deducted from operating revenue. For this reason, it is sometimes known as the bottom line.
Net profit is an indicator of a company’s overall profitability and whether it is creating value for shareholders. Unlike gross profit, which only accounts for COGS, net profit is what remains after all costs have been deducted.
Other comprehensive income represents the total change in a company’s equity over the period, excluding transactions with shareholders (such as dividends or stock issuance).
The metric captures items that are not involved in key operations but can still impact the company’s overall financial position. Examples include:
When considered in conjunction with the rest of a financial report, cash flow statements enable readers to evaluate an entity’s:
Unlike the income statement, which recognises revenue when it’s earned and expenses when they’re incurred (accrual accounting), cash flow statements focus exclusively on cash transactions.
Here is how cash flow is recorded and reported.
Cash flow from operating activities describes cash that is earned or spent by the entity’s revenue-producing operations.
Examples include:
Cash flow from operating activities is related to net income but includes adjustments to reflect actual cash movement in the company.
To that end, it adjusts for changes in working capital such as accounts receivable and also non-cash items like amortisation and depreciation.
Positive cash flow indicates that the company generates sufficient cash from its core activities to sustain and grow the business.
Cash flows from investing activities represent cash inflows and outflows that result from investments. This section of a financial statement may encompass the purchase or sale of property, equipment, securities and even other companies or business units.
Growing companies tend to report negative cash flow from investing activities as they tend to reinvest profits into new assets. However, persistently negative cash flow (especially when reported with declining revenue) may be cause for concern for investors.
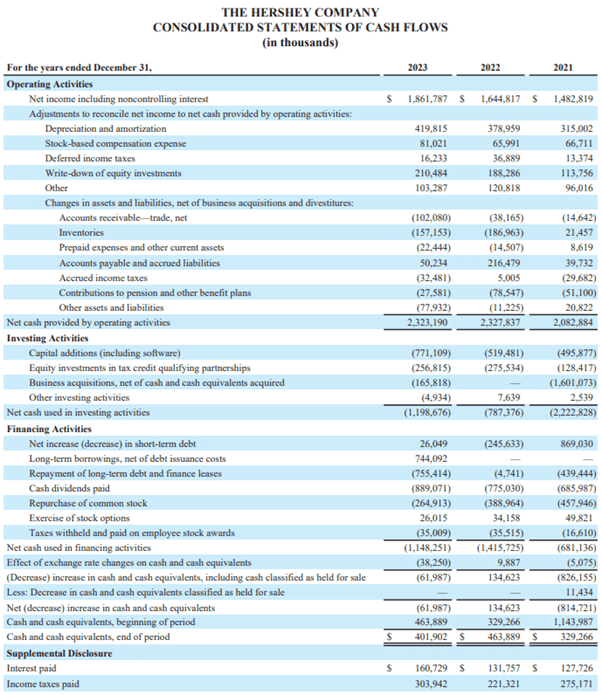
This section shows cash flows related to the company’s capital structure. It includes cash received from issuing debt or equity, as well as cash used to repay loans, pay dividends or buy back shares.
Financing activities reveal how a company raises capital and returns value to shareholders. Substantial debt issuance that does not correspond to revenue growth may become problematic later.
Share buybacks and dividend payouts, on the other hand, tend to reflect management’s confidence in future cash (and thus shareholder value) generation.
As touched on earlier, cash flow statements can reveal what phase a business occupies. In other words, is it a profitable, mature company, a start-up experiencing rapid growth, or a mature business in a state of decline?
Based on this information, an investor or analyst may decide that a start-up with negative cash flow is not worth the risk. The cash flow statement of a company in decline may also be used internally to initiate staff redundancies.
In any case, cash flow is depicted as either positive or negative.
Positive cash flow means more cash comes into the business than out of it over a specific period. While positive cash flow enables the company to reinvest in its future success or pay off debt, it does not necessarily translate to profit.
A company can be profitable but have negative cash flow – especially if revenue includes sales on credit or if there are sizeable non-cash expenses like depreciation. Conversely, a company that raises capital via loans and investments can be cash flow positive but not profitable.
Negative cash flow is the opposite and refers to a situation where cash flow exceeds cash inflow over a specific period.
Like other aspects of how to read a financial statement, it’s important to consider the context.
Negative cash flow may be reported by a growing business that makes large investments in assets like equipment and technology. Another business may report the same if it decides to pay off debt or issue dividends.
Prolonged or chronic negative cash flow across all sections of the cash flow statement, however, are worth deeper analysis. It could indicate that the company is burning through cash reserves or taking on debt to sustain operations and may become insolvent.
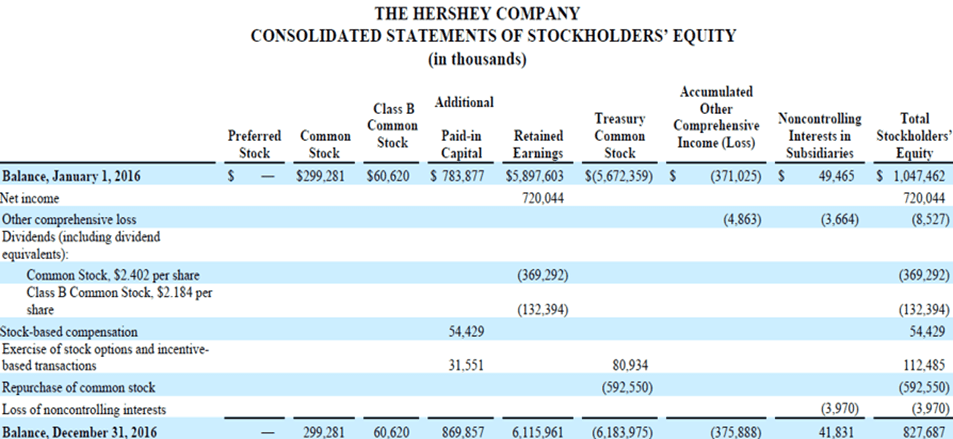
The statement of shareholders’ equity provides a detailed overview of changes in the equity portion of a company’s balance sheet. In some financial reports, it’s titled “Consolidated statement of changes in equity” or included as part of the balance sheet.
The statement clarifies how net income, dividends, stock issuance and various other factors impact the value of shares held by shareholders. Investors analyse this data to understand how a company distributes or reinvests its profits to their benefit.
Some of the key elements of an equity statement include:
Various financial ratios help analysts, investors and business owners evaluate a company’s health and performance. Specifically, the company’s liquidity, profitability, efficiency and leverage.
To round out this article, let’s look at three important financial ratios by category.
Liquidity ratios measure a company’s ability to meet its short-term debts with short-term assets. In other words, how quickly can the company convert its assets into cash to meet its immediate obligations?
The current ratio is calculated by dividing current assets by current liabilities. When the ratio is above 1, the company has more assets than liabilities which may be indicative of financial stability.
Profitability ratios determine how efficiently a company is turning revenue into profit and are used to assess its overall financial health and business strategy.
Profitability can be expressed as gross profit margin, which is calculated by dividing gross profit by revenue. Since gross profit margin measures how much profit a company makes after COGS is subtracted, it offers clues about a company’s pricing strategy and cost control.
Leverage ratios assess a company’s use of debt relative to its assets or equity. These ratios help determine how much risk the company is taking by borrowing money to fund its operations or growth.
The debt-to-equity ratio shows the proportion of debt a company uses to finance its assets relative to equity. It is calculated by dividing total debt by total shareholder equity.
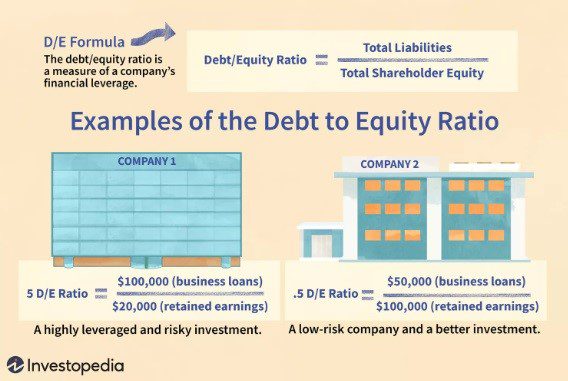
Higher debt-to-equity ratios mean the company uses more debt to fund its operations. This strategy is often associated with higher investment risk.
However, since the ratio can be distorted by intangible assets and retained earnings or losses, it is important to conduct further research to determine the extent to which the company relies on debt.
As a result, some investors consider debt-to-equity in the context of short-term factors. These include profitability, growth expectations and the cash ratio – which evaluates a company’s short-term leverage by dividing the sum of its cash and marketable securities by its short-term liabilities.
Summary:
Multi-factor authentication (MFA) is a security method that requires users to prove their identity using two or more distinct factors before accessing …
Imposter scams are a type of fraud where scammers pretend to be trusted individuals, companies, or government agencies to deceive victims into …
Accounts payable fraud is a deceptive practice that exploits vulnerabilities in a company’s payment processes. It occurs when individuals—whether employees, vendors or …
Eftsure provides continuous control monitoring to protect your eft payments. Our multi-factor verification approach protects your organisation from financial loss due to cybercrime, fraud and error.