Finance glossary

What is a profit and loss statement?

Bristol James
5 Min

A profit and loss statement, also known as an income statement, is a report that outlines your net profit for a certain period of time, such as one month or one year. This financial statement summarizes your revenue and operating expenses, giving detailed information about how your business is generating revenue, managing costs, and making profits. 

P&L statements are one of the three main financial statements, alongside the balance sheet and cash flow statement. Businesses will usually generate these three reports together to give investors, lenders, and owners a snapshot of the financial performance of the company during the period.

Who Uses a Profit and Loss Statement?

If you’re a business owner, you’ve probably been asked to provide a profit and loss statement at some point. Many organizations use profit and loss statements to make informed decisions. Here are some of the people that might request this document:

  • Management – Business owners and members of management rely on the profit and loss statement to guide decision-making surrounding upcoming expenses, growth opportunities, and pricing.
  • Investors – Investors want to evaluate the financial performance of your company before handing over capital. Most investors are looking for growing sales and improving profit margins.
  • Creditors and Bankers – Creditors and bankers use your profit and loss statement to determine your lendability. If your business is showing stagnant growth and a net loss, they might be hesitant to lend money to your organization.
  • Financial Analysts – Financial analysts utilize the profit and loss statement to complete in-depth analysis and provide insights to clients, investors, and other third parties. They look for trends and ratios to draw conclusions.
  • Government Agencies – Government agencies and other regulators use the profit and loss statement to determine tax liabilities and track compliance.

P&L Statement Sections

Profit and loss statements can be generated in two different ways: cash and accrual. Cash basis financial reports only show transactions that cleared the bank account during the time period. On the contrary, the accrual method of accounting will generate a profit and loss statement with revenue and expenses incurred, but not received or paid.

Regardless of the accounting method used, P&L statements will all contain the same sections, including:

  • Gross Revenue – This is the top section on the P&L statement, outlining your different revenue streams.
  • Cost of Goods Sold – This section contains expenses directly related to revenue, such as direct labor and raw materials.
  • Selling Expenses – These costs go toward advertising and selling your products and services, like commissions and marketing costs.
  • Occupancy Expenses – This section outlines your rental costs, such as utilities, rent payments, and maintenance.
  • Operating Expenses – These are general and administrative expenses, like office wages, bank charges, and liability insurance.
  • Other Income and Expense – Any expense or income item that does not fit into one of the above categories will be found in other income and expense.

Within each of these categories, there will be subgroups of expenses. For example, your cost of goods sold category could contain machinery depreciation, wages, raw materials, and freight.

Calculating Net Income

The bottom-line number on your profit and loss statement, also known as net income, is a crucial number that summarizes your profitability for the period. Calculating net income can be done with the following formula:

Revenue – Expenses = Net Income

However, there are other formulas that you can calculate from your profit and loss statement. Here is a more detailed breakdown of the net income formula:

Revenue – Cost of Goods Sold = Gross Profit – Operating Expenses = Operating Income – Other Income/Expense = Net Income

Using this formula allows you to calculate other important metrics, like gross profit margin and operating income. These numbers play a vital role in evaluating the financial health of your business operations.

Comparing Profit and Loss Statements

The P&L statement is a fundamental financial statement for a reason. It provides key information about business performance, informing leaders and stakeholders on a variety of different things.

Comparing profit and loss statements can be done in a few different ways. Let’s cover a few of the comparison strategies in more detail:

  • Revenue Trends – Analyzing revenue trends between periods gives you information about which products and services are performing the best and sheds light on potential expansion opportunities.
  • Expense Management – Comparing expenses between periods highlights areas your company might be overspending, allowing you to make adjustments going into the next period.
  • Net Profit Margin – A net profit margin that increases between periods indicates your company is generating more profit.
  • EBITDA – Earnings before interest expense, taxes, depreciation, and amortization (EBITDA) is a financial formula that calculates earnings before certain financing and non-cash transactions are included.
  • Other Ratios – There are a variety of financial statement ratios that evaluate the health of your business, including operating margin, price-to-earnings, and gross margin.

When it comes to comparing the P&L statement between periods, you need to have a standardized process. For example, using net profit margin in one period and sales growth in another won’t give you comparability. Create a list of analysis tasks and track them each period to maximize insights.

Profit and Loss Statement Example

Many companies are required to issue audited profit and loss statements. Below is Amazon’s 2023 profit and loss statement.
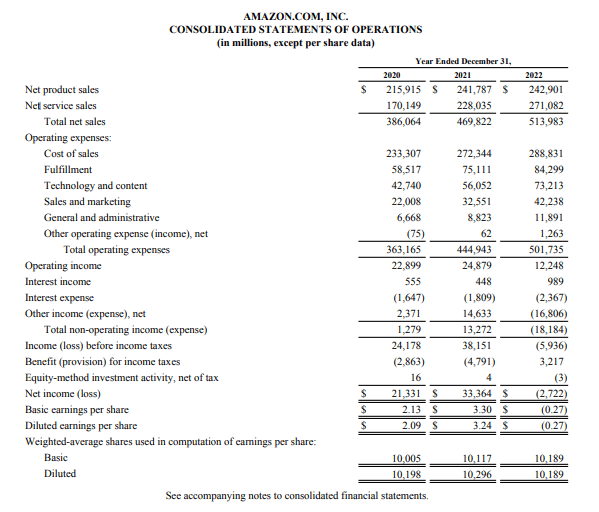
Amazon Profit and Loss Statement

From looking at this statement, we can see that Amazon breaks out total sales by service and product. In addition, their main expense categories include cost of sales, fulfillment, technology and content, sales and marketing, general and administrative, and other operating expenses. Each company will create a profit and loss statement template unique to their business operations. However, profit and loss statements are still subject to accounting principles established by regulatory authorities, like the FASB and IASB.

The Steps to Create a Profit and Loss Statement

Creating a profit and loss report is relatively straightforward. Here are the steps involved:

  1. Post Transactions – First, you will ensure all transactions are posted to your general ledger. If you use a separate expense management software, be sure the connection is still active and all necessary transactions are in your accounting system.
  2. Pull Profit and Loss Report – Now, you will go into your reporting function and pull a profit and loss statement for the date range needed.
  3. Review for Accuracy – The profit and loss statement should be reviewed for accuracy. During this stage, it’s helpful to pull a comparative profit and loss statement to compare balances to the prior period.
  4. Finalize Report – Next, you will make any adjustments and finalize the report. Leaders and other members of management should also be involved in creating external messaging for the profit and loss statement.
  5. Provide to Auditors or External Parties – If your accounting records are being reviewed or audited, you will provide your finalized profit and loss statement to your accounting professional. If no audit is required, you can issue these statements to external parties, like creditors and government agencies.

Summary

  • The profit and loss statement is a financial statement that outlines your revenue, expenses, and net income for a specified time period, such as one month or one year.
  • Business owners, investors, bankers, financial analysts, and government agencies use the profit and loss statement to make informed decisions.
  • Net income is found by subtracting revenue from expenses.
  • Analysis of revenue trends and expenses, calculating financial ratios, and comparing data between periods are top analysis methods.

Related articles

Finance glossary

What is a ledger?

A ledger, also referred to as a general ledger, is a list of financial transactions. This financial report summarizes transactions for a …

Read more
Finance glossary

What is an Open-End Mutual Fund?

An open-end mutual fund is a portfolio that is comprised of pooled investors that can issue an unlimited number of shares. Mutual …

Read more
Finance glossary

What is Net Asset Value (NAV)?

Net asset value, known as NAV, is a method for calculating the value of an investment fund or mutual fund. This valuation …

Read more

The new security standard for business payments

End-to-end B2B payment protection software to mitigate the risk of payment error, fraud and cyber-crime.